Back • Return Home
Click for larger version.
To quote the article "Integration in Human Ecology":
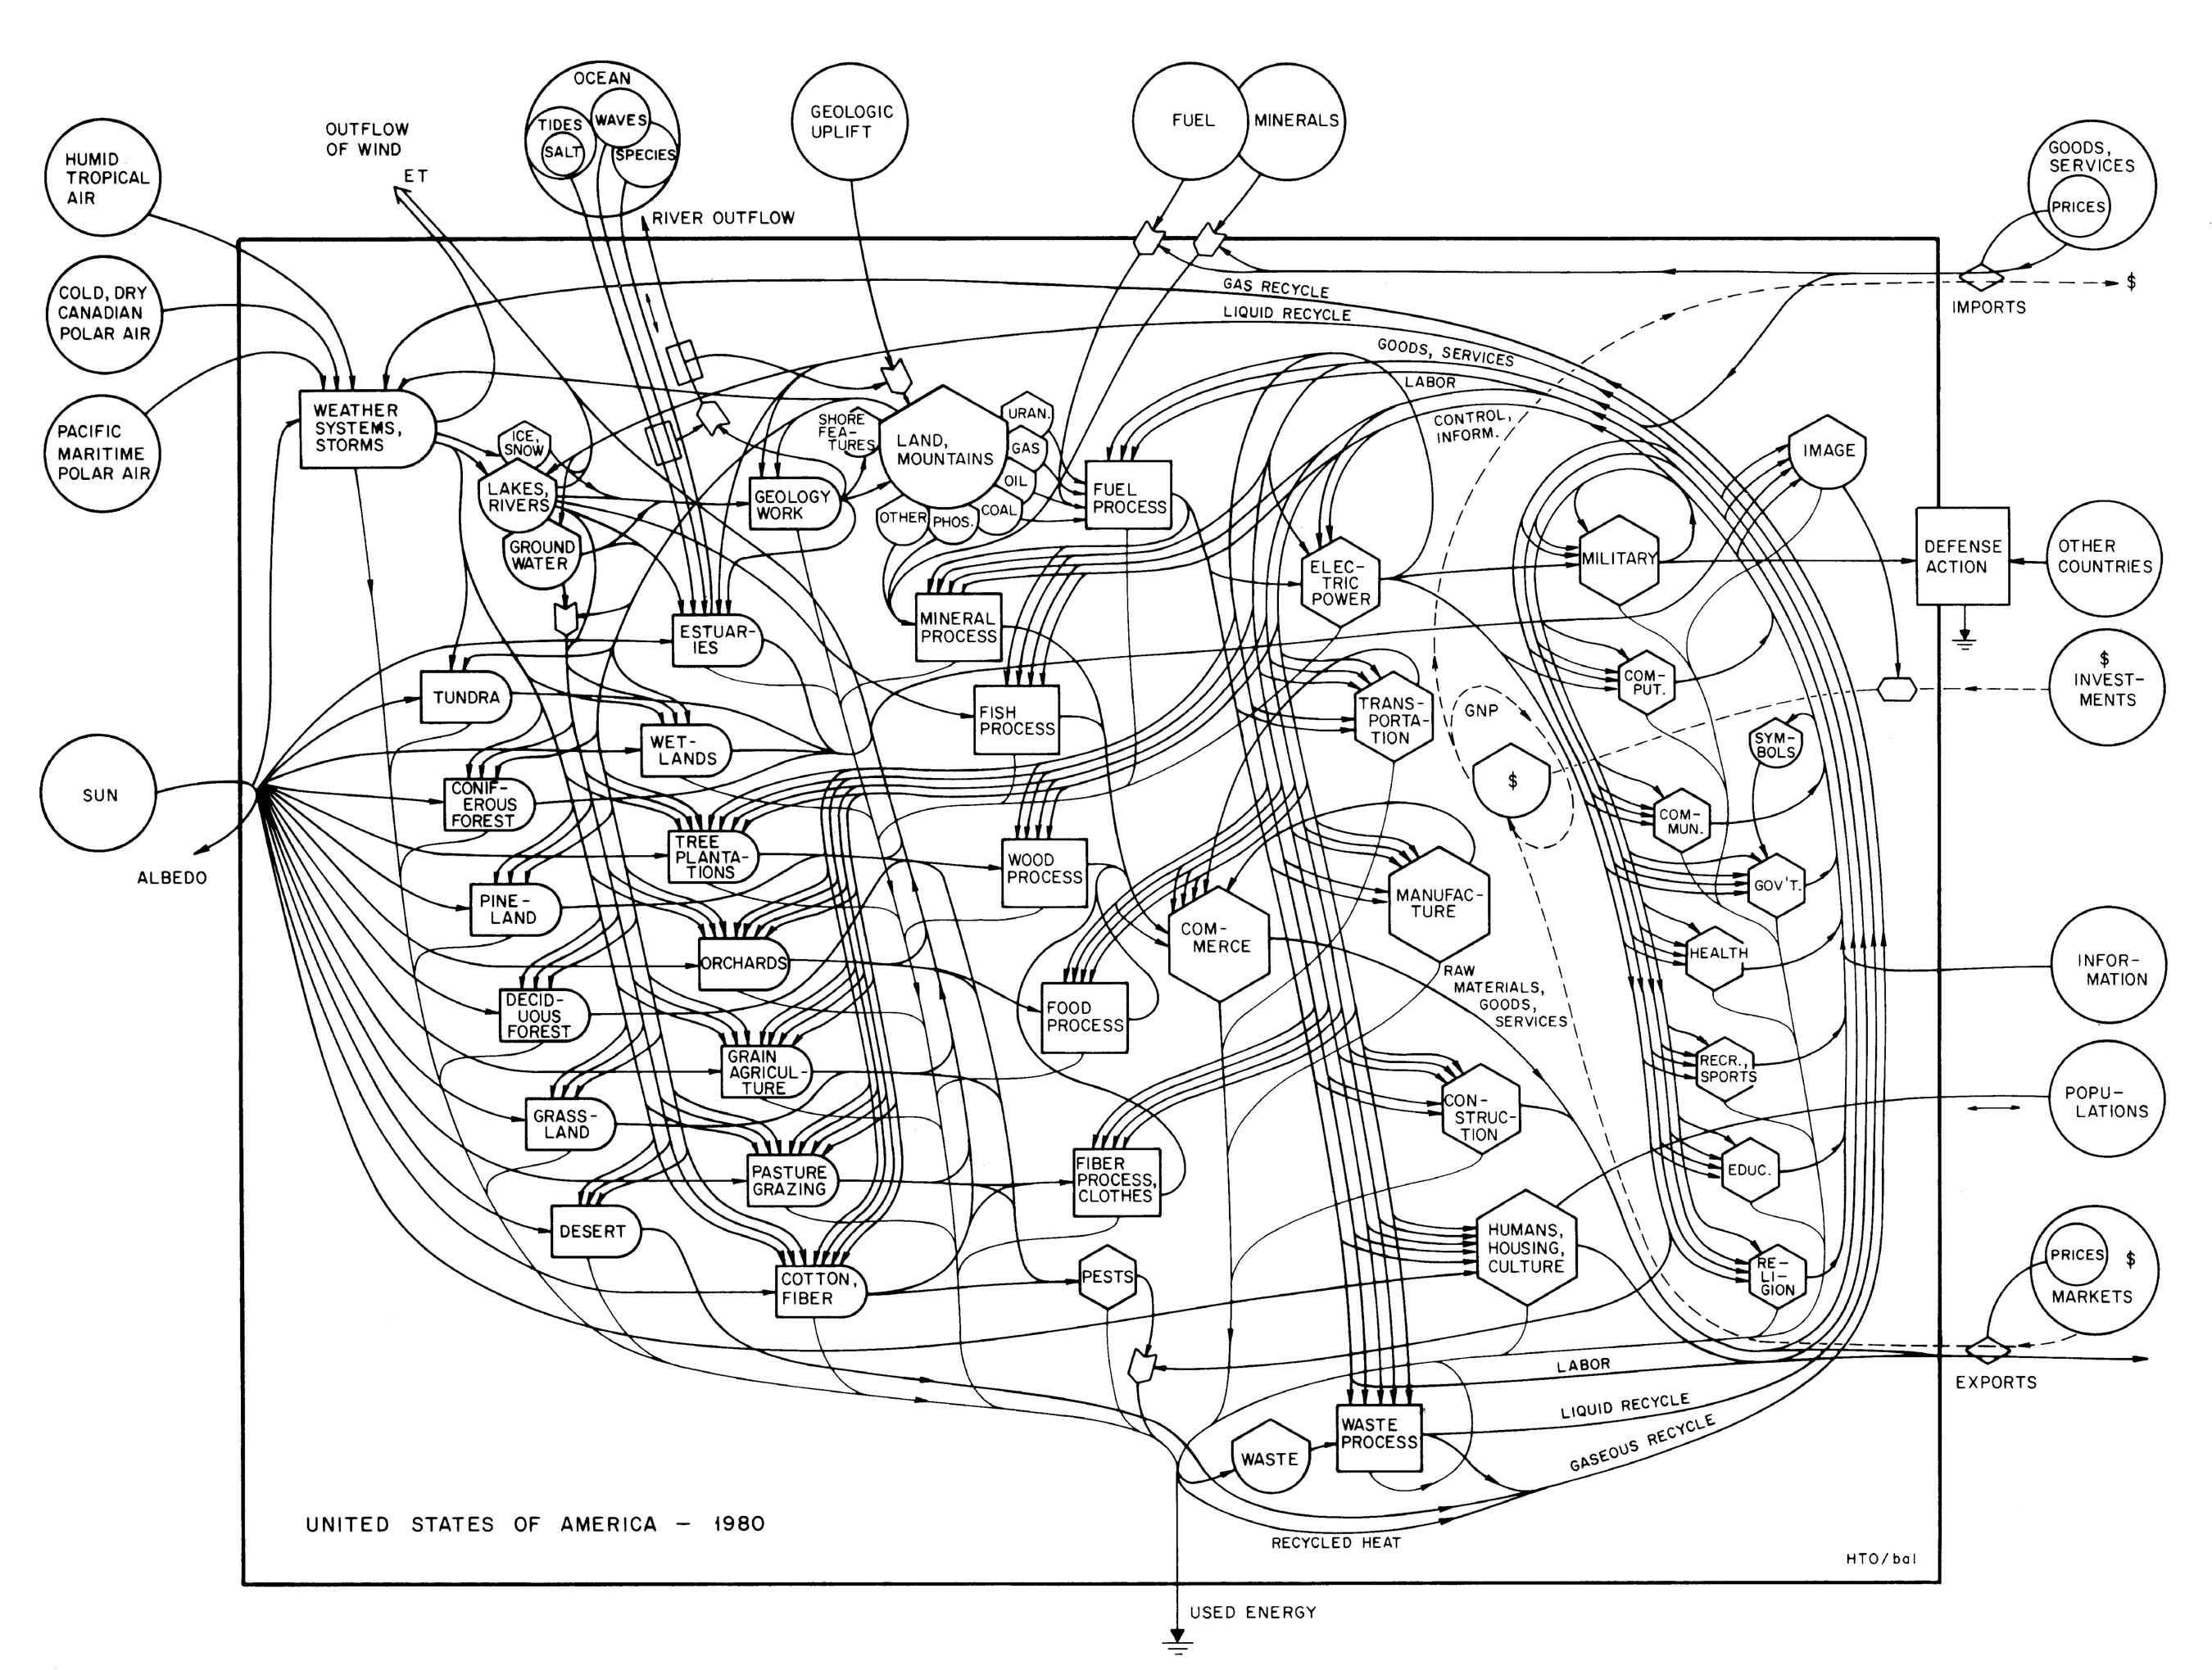
An Ecological Model of the Economy of the United States of America in 1980 (H.T. Odum 1983, Figure 23-17).
The modeling conventions used here are based in part on thermodynamic principles: the conservation and entropy laws. The global heat sink at the bottom represents all the entropy losses. Circles represent sources of energy that serve to drive the system. Energy storage is depicted with a birdhouse-like icon. The bullet icon represents producers of energy (plants) from which energy flows to consumers, depicted by the hexagon. The arrowheads are flow interaction or control gates. Rectangular enclosures are used for miscellaneous subsystems and processes. There are two types of flows: 1) a straight line depicting energy flow, and 2) a dashed line with a $ sign depicting money flow.
There are five subsystems that are grouped together in staggered columns with the vertical groupings suggesting relationships between the components in each column. The first column (starting at the left) represents biomes. The second, ecosystems, with the vertical hierarchy based on degree of human manipulation (top less, bottom more). The third and fourth columns depict commerce: the third column shows processes that have some non-human energy inputs, while the fourth are fully industrial processes using fossil fuels. The last column represents a variety of human social sectors and institutions. Overall, the subsystems and their dominant flows are arranged left to right in order of increasing energy quality (increasing amounts of embodied energy).
Maps of a similar complexity have been done by the Idiagram consulting firm. The ones on the global food system and how we relate to it are particularly relevant.