Back • Return Home
Sustainable Systems
The following are notes taken on Donella Meadows' lecture "Sustainable Systems" given at The University of Michigan on March 18, 1999.
Please note that the following sections are presented in an order different from the lecture itself. This was done so as to make it easy to understand from beginning-to-end. We have attempted to use color coding consistently throughout (i.e.: same color = same meaning). Some extra explanations and resources are also given.
Contents
• What is a "System"?
• The Basics of System Dynamics
• Properties of Sustainable Systems
• Places to Intervene in a System
• Causes of Unsustainability and Collapse
• Economic Control?
• Words of Caution
• What Can We Do?
• Conclusion
• Planetary Boundaries (Addendum)
What is a "System"?
A "system" is a set of interrelated elements organized to serve a particular function or to seek a particular goal.
• The elements are the physical things (e.g.: people, factories, etc.). You can sense and count them.
• The interrelationships are what hold the system together (e.g.: rules, information signals, etc.). They are the "structure" of the system.
• The function or goal is the result that is produced. It can be completely different from what the people who are part of the system might say it is!
Two basic, yet crucial insights about systems:
1. Behavior within the system usually appears as a result of the interrelationships and goals of the system itself, not the elements that make it up. Find out what is wrong with the system before blaming individual people. Oftentimes, the structure and aims of the system itself motivate people to act in certain ways.
2. Focus in on the interrelationships. Sometimes we can switch out all of the elements of a system and it will still function the same way.
Some familiar systems sayings:
• "Everything is connected to everything else."
• "The whole adds up to more than the sum of the parts."
"Reductionism" is to learn about something by taking it apart and studying its pieces. "Holism" is to put those pieces together and study how the whole interacts. There are no "trade-offs" when all things are deeply interconnected!
The Basics of System Dynamics
System Dynamics is a way of modeling and simulating systems. It was invented by the computer engineer Jay W. Forrester. He applied it towards understanding organizations, entire cities, and even the world as a whole. There are some free PDFs for learning the basics, a glossary of terms, and a self-study course on how to use the mathematical and computer-based tools behind System Dynamics available elsewhere on the Internet. Here, we are only going to give enough information to understand Donella's diagrams.
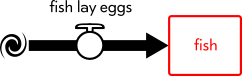
• A "Stock" is essentially an element, something that we can sense and count. We will represent it as a box. For example, here is a Stock that represents the number of fish within an ecosystem:
• A "Flow" is a large arrow that describes how the amount of a Stock changes. When the arrow is entering the box, it describes a behavior that increases that Stock. For example, fish lay eggs, which increases the number of fish:
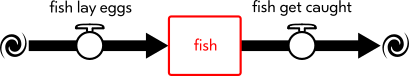
When the arrow is exiting the box, it describes a behavior that decreases that Stock. To continue our example, fish die or are caught:
Notice that each arrow has a circle with a little handle on it:
This is like the handle of a faucet. It symbolizes the fact that the Flow itself can change. For example, if we open a faucet more, the flow of water increases. Inversely, if we close the faucet, the flow of water slows or stops. Similarly, the rates at which fish are born and die can increase or decrease.
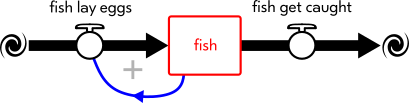
• A "Feedback Loop" is when the result of a process affects its cause. This relationship can reinforce a behavior (a "Positive Feedback Loop" represented by "+") or balance it out (a "Negative Feedback Loop" represented by "-"). For example, there needs to be fish present in order for more fish to be born:
The blue arrow in the above diagram is a Positive Feedback Loop.
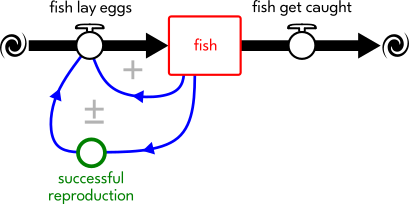
It is also a goal of the fish to reproduce successfully:
The green circle represents the "regeneration rate" (i.e.: how fast new fish are being born). The more fish that there are, the faster that new fish can come into being, but only up to a certain point. Again, fish cannot reproduce if there are not enough fish to do so, or if there are too many fish for that environment (i.e.: if that ecosystem is at "Carrying Capacity" for that species). Therefore, this Feedback Loop can be positive or negative depending upon how many fish there are, hence the "±".
Properties of Sustainable Systems
Three Rules [after "The Steady-State Economy" work of Herman Daly]:
1. Every RENEWABLE RESOURCE must be used at or below the rate at which it can regenerate itself or be regenerated.
2. Every NON-RENEWABLE RESOURCE must be used at or below the rate at which a renewable substitute can be developed.
3. Every POLLUTION STREAM must be emitted at or below the rate at which it can be absorbed or made harmless.
Fourth Necessary Characteristic [after "The Natural Step Framework" of Karl-Henrik Robèrt]:
4. To be SOCIALLY SUSTAINABLE, capital stocks and resource flows must be EQUITABLY DISTRIBUTED and SUFFICIENT to provide a good life for everyone.
Currently, there are NO human-made systems that fulfill all of these criteria! We are literally surrounded by and are personally a part of many unsustainable human-made systems.
Places to Intervene in a System
How do we redirect a system? By shifting one or more of the following:
Function or Purpose
↓
Interconnections, Relationships
↓
Elements
↓
Behavior
↓
Events
As long as they are not blocked from occuring, things higher on the list usually have a greater influence on the system as a whole. For example: Changing the purpose of a system, or how information flows through it, can make a huge difference in its behavior, whereas switching out elements may have little to no effect unless it also changes the function or relationships within that system. For more information on how to shift a system, see Donella's brilliant article "Leverage Points".
A snippet of a system's long-term behavior is an "Event". News has a tendency to focus in on these Events. At best, it only hints at the things that are higher up on the list.
Causes of Unsustainability and Collapse
Unsustainability is when a system undermines its own means of support. The principles behind this will be demonstrated through an extremely simplified model of a fishery. This example was chosen for its relevance to current events.
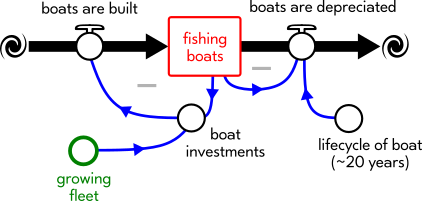
First, we will describe a Stock of fishing boats similar to our Stock of fish:
In this situation, a boat only lasts a certain length of time (approximately 20 years) until it has to be depreciated (i.e.: retired from use). It costs money for new boats to be built, to invest in repairs, new features, and/or tools for fishing. If he can afford it, the captain has a goal to increase the size of his fleet at a certain rate.
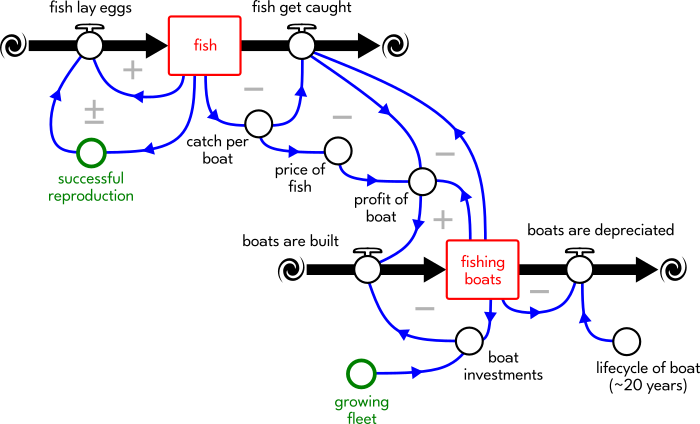
Next, we will relate the fish and fishing boats to one another:
This diagram might look complicated, but the relationships that it is modeling are simple. All it does is map out how fishing boats make money from catching fish. Let's take it step-by-step...
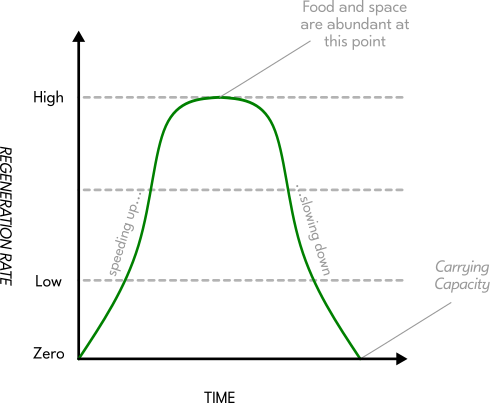
If we left the fish population alone, it would follow a pattern something like this:
We will call this a "Breeding Curve". It doesn't matter how many fish there are. They will always form a graph like this, although the "hump" of the curve may move to the left or right. This just means that the rate at which the fish are regenerated will rise up to a certain point, and then start to drop until it reaches zero at Carrying Capacity. In other words, the regeneration rate is zero if there are too few fish or too many fish.
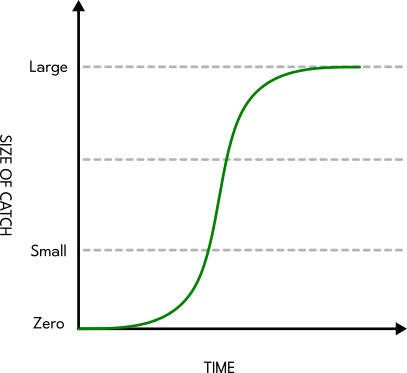
This "s-curve" represents the amount of fish that the fishing boats are able to catch. It depends on how many boats there are and on how sophisticated their tools for catching fish are. It rises sharply and then hits an upper limit (i.e.: the top of the curve where it flattens out). Donella refers to this as a "Technology Curve" because it represents how fast technologies are adopted (whether they be new boats, bigger nets, RADAR systems for tracking fish, etc.). [Mathematically, it is known as a "Logistics Curve".]
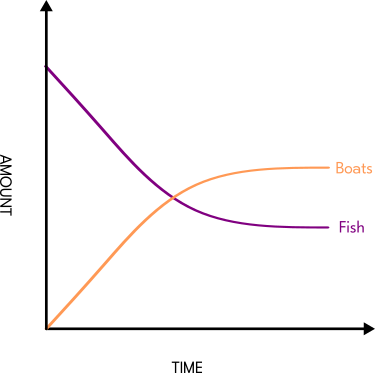
Generally, as the number of boats increase, the fish population goes down. If growth goes unchecked, things will continue until collapse. As long as they are functioning properly, Negative Feedback Loops can be used to balance out this growth to make the system sustainable again.
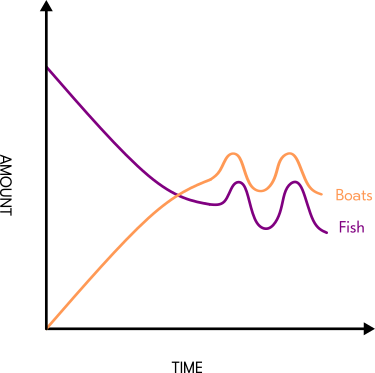
If the Negative Feedback Loops are not strong enough, there will be an oscillation between overfishing and recovery. This is because when too many fish are taken, the catch goes down and the boats depreciate in value until the fish can restore themselves. This oscillation is equivalent to what is known as a "Predator-Prey Curve". The boats are the "predators" and the fish are the "prey".
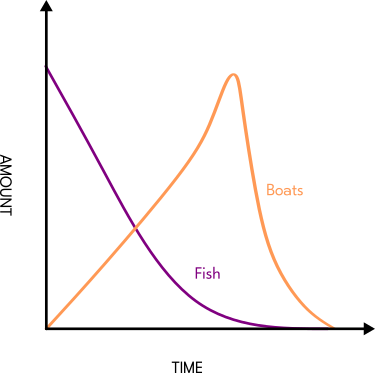
This last relationship is referred to as "Overshoot and Collapse". If their activity is not adjusted, the fishing boats will eventually cross over the "hump" in the Breeding Curve of the fish. In other words, the number of fish caught becomes greater than what can be sustained. The fish are being taken faster than they can replenish themselves. What can be frightening about this situation is that everything "seems fine" until you realize that the system is already past "the point of no return". To try to predict it, we have to pay close attention to the state of the fish population, not whether the fishing boats are making a profit!
Economic Control?
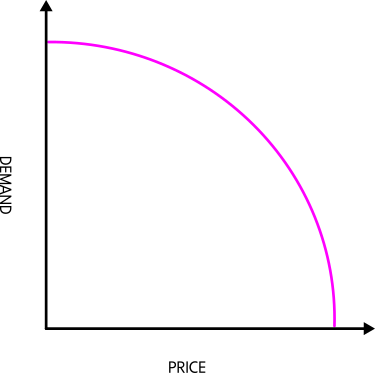
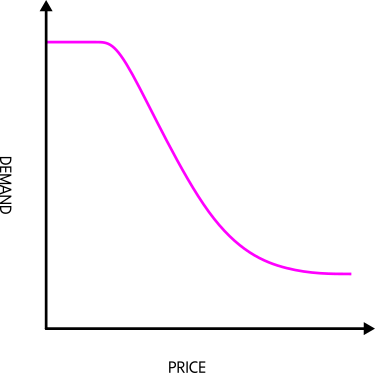
Some might question, "Doesn't the 'price system' keep the situation balanced?" As things become more scarce, their price increases. As the price goes up, there is less demand. We can represent this relationship like so:
This is an "Income Elasticity (of Demand) Curve". Ideally, as the fish got more rare, their price would increase until demand dropped down to zero. The fish would then be able to replenish themselves, and their price would naturally go back down as their population increased. However, the above situation assumes that everyone has an equal income. What actually happens is something like this:
Income is not equally distributed. Society is often split into "rich" and "poor". Likewise, the demand never goes down to zero. It only decreases until that fish is impossible to buy for everyone except the richest of people. These circumstances speed up collapse because there will always be some people who will pay huge amounts of money for the rarest fish. The incentive for catching the fish has not gone away.
The patterns that we have covered here apply to all natural resources. For example, instead of using them to describe the disappearance of animals in the ocean as they are fished into extinction, we can also use them to describe the "desertification" that occurs from "deforestation" (i.e.: when so many trees are cut down that a forest turns into a desert).
Words of Caution
Many people are pursuing things that are actually making these crises worse:
1. Growth
There is an assumption that "all growth is good" so there is a desire to keep growing without limit.
2. Technology
Rather than healing ecosystems, technology is often applied towards destroying things more efficiently.
3. The Market
The market reinforces the two previous points when inequality is present.
4. The Government
Government intervention usually reinforces the market.
Those are systemic problems that economic and political reform won't fix. For example, a "subsidy" (i.e.: financial assistance from the government) to make the rare resource "more affordable" just speeds up collapse. Likewise, a subsidy that helps businesseses to grow or invest in technologies to catch more fish also speeds up collapse.
Notice that points 3 and 4 completely undermine the Negative Feedback Loops that would normally check points 1 and 2. This is related to a principle called "success to the successful". This is when Positive Feedback Loops encourage more of the same (e.g.: the more money that you have, the more opportunities that are available to you to make more money). It is also the main reason why there is inequity (e.g.: division into people who are "rich" and people who are "poor").
What Can We Do?
1. We must cultivate meaningful, moral, and satisfying goals that give us a sense of enough.
2. We need Positive Feedback Loops balanced by Negative Feedback Loops appropriate to one another in scale.
3. We need clean, clear, fast, and compelling information flows.
Unfortunately, prices do not reflect the true cost of things, and media is mostly entertainment that does not inform people of vitally important information.
4. We need to protect our resource base by increasing:
• Resilience - the ability to restore oneself after a shock
• Self-Organization - the ability to pull aspects of the system together to function
• Evolution - the ability to create entirely new things that did not exist before
These three abilities are how a system changes. They include both Natural sources of change (such as "biodiversity"), and human-made sources of change (such as technology).
5. We need social equity. People cannot be struggling to simply survive!
Conclusion
We can add one more thing to the top of the list of places to intervene in a system:
Mindset
↓
Function or Purpose
↓
Interconnections, Relationships
↓
Elements
↓
Behavior
↓
Events
One's mindset directs all other aspects. We have to look at reality completely differently and challenge the Feedback Loops that encourage "success to the successful". For example, the assumption behind "overpopulation" is that the more people there are, the less resources that we will have overall. Instead of attempting to control the birth rate though, we should find ways to increase the quality of life for everyone without putting a burden on the environment. The birth rate will fall naturally as a result.
Planetary Boundaries (Addendum; June 18th, 2026)
This is not part of the original lecture, but it seems appropriate to explore these topics a little further...
"Earth Systems Science" allows us to consider the impacts of human civilization (the "technosphere") on the Earth itself (the "ecosphere"). [We've spoken elsewhere about "The Limits to Growth" study done by Donella Meadows and others on behalf of The Club of Rome, as well as the related research done by The Stockholm Resilience Centre.]
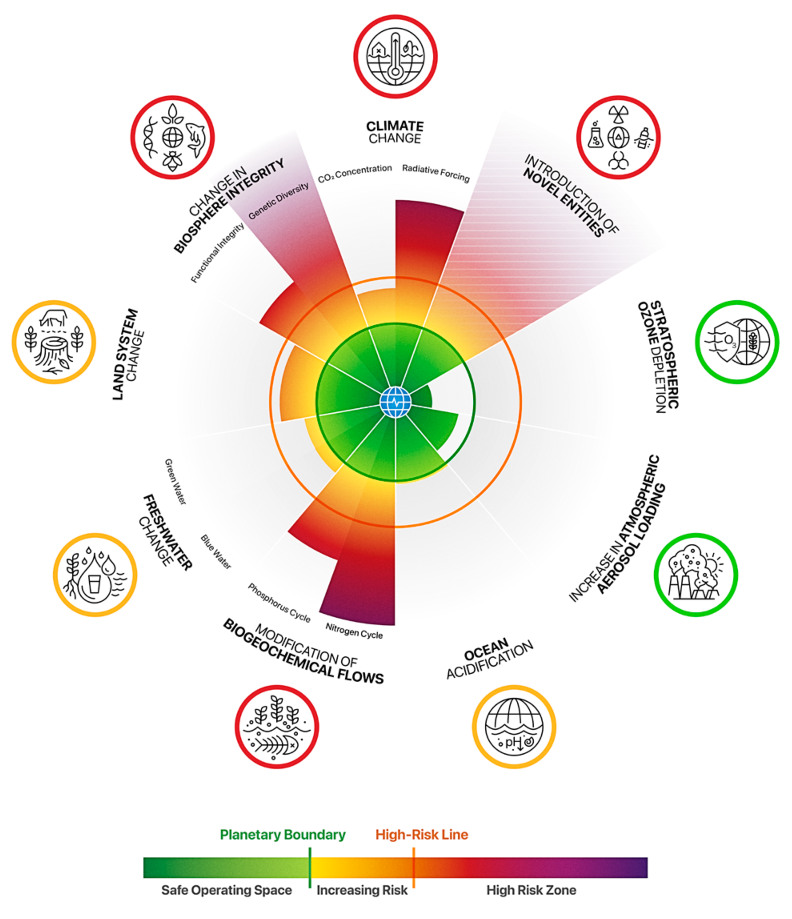
A "planetary boundary" is a threshold that we should not pass if we want to prevent situations like overshoot and collapse worldwide. We seem to be exceeding multiple planetary boundaries (seven out of the nine that have been assessed, to be exact):
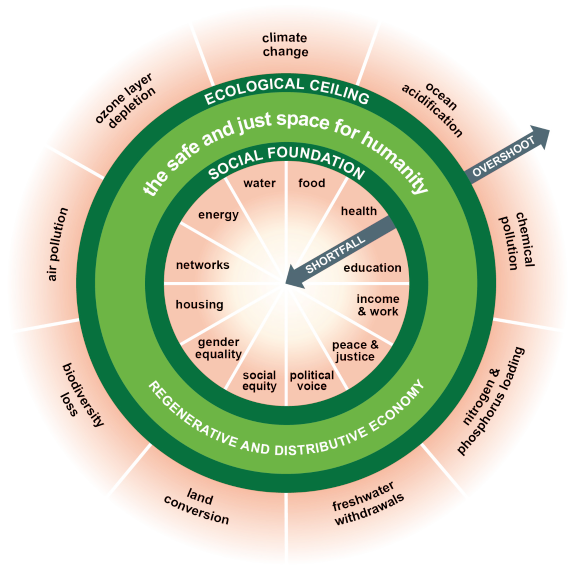
Ideally, our social institutions would be structured in a way that facilitates balance, keeping these planetary boundaries within the proper range to sustain everyone. This range is sometimes referred to as "the doughnut" [based on the work of Kate Raworth]:
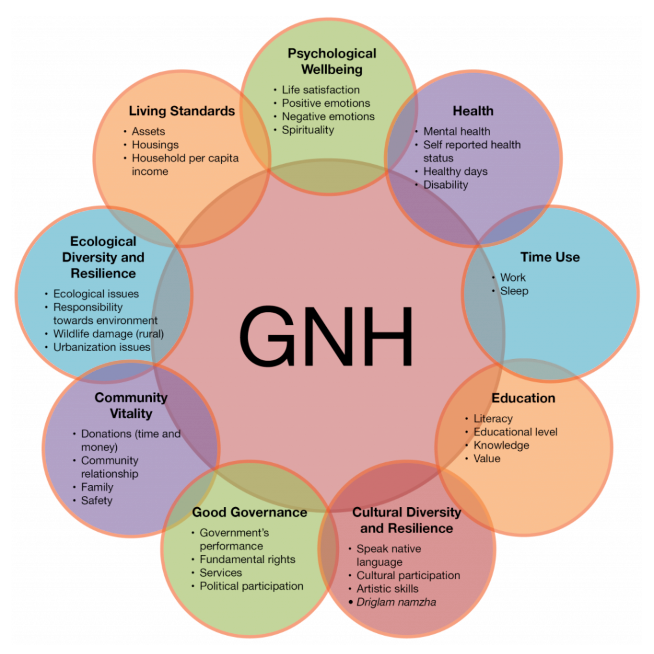
There have been several criticisms of the dougnut model. To be honest, some of them can seem a bit like excuses for a continued focus on opulence. Much like the "success" of the fishing fleet within the above example, the Gross Domestic Product (GDP) is NOT an indicator of what is sustainable. It isn't even an measure of Quality of Life!
One index that attempts to capture the "non-economic" aspects of social well-being is Gross National Happiness (GNH):
It seems reasonable to conclude that, as humanity links what it does more thoroughly to its ecological context, the less that concepts like "government" and "economics" will have relevance. "National" boundaries give way to bioregions. And further, instead of using any "medium of exchange" (like money), we focus directly on utilizing the "three rules and fourth necessary characteristic" to sustain all life within each of those bioreigions.