Back • Return Home
A Summary of The Viable System Model
The following is essentially a distillation of the Falcondale Collection of lectures.
Introduction
A researcher by the name of Stafford Beer developed The Viable System Model (or "VSM" for short) as a way of structuring a system so that it remains "viable" (i.e.: self-sustaining).
It has its roots within the work of mathematician Norbert Weiner, as part of a team of scientists who gathered for the Josiah Macy Jr. Foundation conferences held throughout 1946 - 1953. The main objective of these conferences was to develop a multidisciplinary understanding of the idea of "control", not in the sense of force or manipulation, but in the sense of implicit guidance (i.e.: how things direct themselves). Norbert called this field of study "Cybernetics", which comes from the Greek κυβερνήτης ("kubernetes") meaning "steersman" (i.e.: the person who controls the rudder of a boat). It had a fundamental impact on the development of computers at the time, hence the extensive use of the prefix "cyber-" for computer-related ideas. However, the term Cybernetics is much more broad in scope. It applies to biological and social systems in addition to technological ones.
Basic Concepts
We usually think of the term "variety" as synonymous with "possibility", but this word has a very distinct meaning in Cybernetics. Variety is the number of different states that a system can take. It is a measurement of complexity. Most systems are so complex that it is impractical to try to count all of their different states. Instead, we generalize about Variety through comparisons (e.g.: "this seems more complex than that").
All systems follow "Ashby's Law of Requsite Variety", which states that "only Variety can absorb Variety". In other words, in order for two systems to interact smoothly, they have to meet each other at the same level of complexity. For example, if there is not enough Variety, things can become vague. A "one-size fits all" approach may leave out important details or nuances. Likewise, if there is too much Variety, things can become overwhelming. There might be too much extraneous information, or data that is irrelevant to the situation at hand.
"The Law of Requisite Variety" (also known as "Ashby's Law") was named after Ross Ashby, a psychologist who helped develop the field of Cybernetics.
Another important concept within Cybernetics is "feedback" (i.e.: when an output signal is "fed back" into the system from which it arises in a loop). This signal can increase the activity which produced it ("positive feedback") or decrease the activity which produced it ("negative feedback"). [For those that are interested, we have described how feedback shows up within the decision-making process elsewhere.]
The body uses feedback to keep its properties within a particular range. For example, we sweat to cool off when we are hot and we shiver to generate heat when we are cold. These kinds of behaviors keep our temperature steady. This state of balance is called "homeostasis", and within the context of Cybernetics, the thing which produces it is called a "Homeostat". Homeostasis is how Nature handles Variety.
Visualizing With The VSM
The observer is part of the system being observed, so measurement is affected by perception. People sometimes focus in on aspects of a system that are not actually relevant to what they are trying to understand, or oversimplify its workings in ways that are misleading. We can become limited by the models that we make. If the Variety of one's model is too low in comparison to the Variety of the system itself, then there is usually trouble. It is important to keep a flexible and expansive view in order to account for uncertainty.
The Viable System Model attempts to strike a balance between flexibility and useful detail. It specifies some important functions that are common to all systems which are "viable", and how those functions can constructively interrelate to keep that system "viable".
Again, a "viable system" is one that is able to sustain itself to some extent. Not everything is considered a viable system, but we can't be too rigid about it either. Schools, churches, businesses, governments, and so on are all viable systems. The fact that these organizations can cycle through their contents while retaining their identity is a form of "viability". For example, a hospital can exist beyond the lifetimes of all of its current staff and patients.
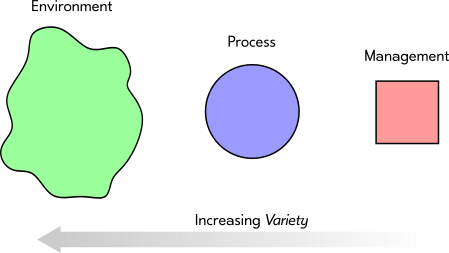
We will represent "management" (i.e.: the thing which is guiding) as a red square:

We will represent the process that is being guided as a blue circle:

We will represent the environment in which all of this is happening as an "amoeba"-like green blob:

It has a wavy border because where the environment begins and ends is not always evident.
Despite not knowing any details about them, we can see that they have differing amounts of Variety:
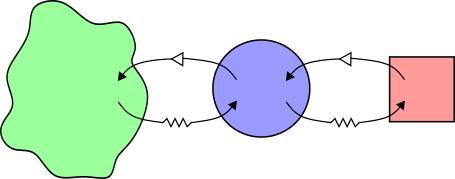
We will represent anything which amplifies or increases Variety as an arrow with a triangle on it:

This is called an "Amplifier".
We will represent anything which dampens or decreases Variety as an arrow with a zig-zag on it:

This is called an "Attenuator".
Amplifiers and Attenuators are both referred to as "Channels". They act like positive and negative feedback loops. Channels can be used to change the amount of Variety between mangagement, the process, and the environment:
When the Variety is balanced throughout, the system runs smoothly. This is called a "Self-Vetoing Homeostat".
The Channels can describe a whole slew of different approaches to changing the amount of Variety in a system. In fact, every possible management technique is described by these four arrows in some way! [Although, each one of these techniques is usually known by some specific name (such as "Total Quality Management", "Just In Time", etc.).]
For example, the Attenuator connecting the blue process circle with the red management square might symbolize an attempt to simplify that process in order to make it easier to understand. Or the Amplifier connecting the blue process circle with the green environment blob might symbolize an upgrade to that process so that it more readily meets the needs of the environment of which it is a part.
In general, management handles complexity, not resources. The idea of a manager that "runs everything" is both false and impossible. Individual people do not have the "Requisite Variety" to control the entire enterprise by themselves.
There are two important things to keep in mind about the Channels:
1. The Channel itself has a certain amount of Variety. This is called "Channel Capacity".
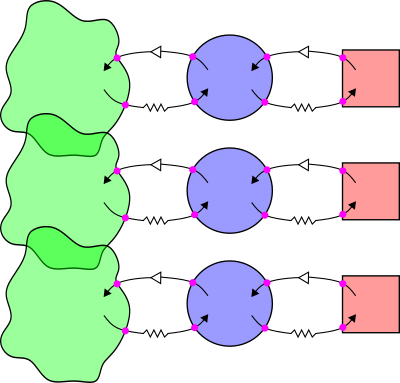
2. In order for a message to be received, there has to be a means of understanding it. This is called a "Transducer". Transducers are symbolized by dots wherever the Channels cross a boundary [shown here in magenta]:
If a Transducer is overloaded with information, it may take some time for it to start working normally again. This is called a "Refractory Period".
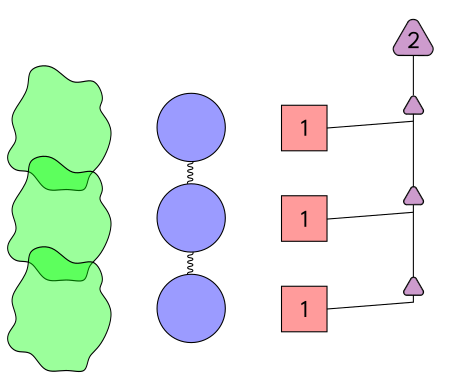
This entire pattern is known as a "System 1". An organization usually has many System 1's operating in parallel. We will represent this situation by stacking a few of them, like this:
This does not necessarily represent a hierarchy! It is just a convenient way of displaying them so that we can see many of them at once. While they are unique in function to some extent, all of these System 1's share the same environment. This is why the green environment blobs overlap in the above diagram.
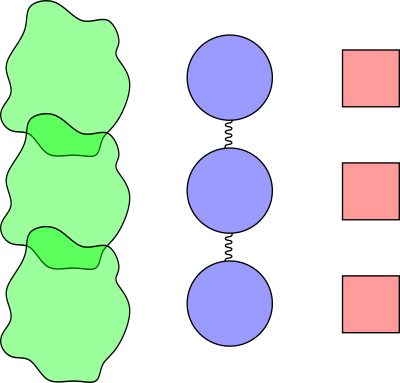
Because they are all functioning together as one whole, the processes within each System 1 are more or less related. We will represent this connection as a squiggly line. It is a squiggly line because this connection can differ in degree. Some processes are directly connected (e.g.: the output of one is the input of another). In other cases, they are only peripherally related (e.g.: they both use the same pool of resources).:
[Note: We have removed all of the Channels to make the diagram easier to see. In practice, they are still there!]
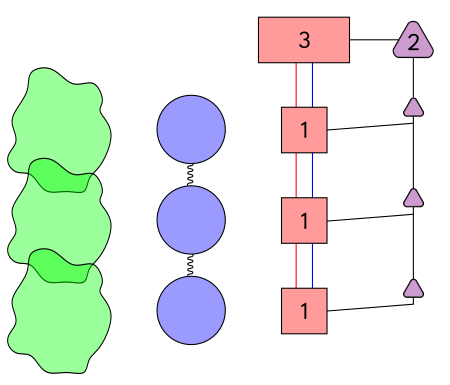
We need some means of keeping all of the System 1's working together. For example, an organization may use a timetable to make sure that everyone has access to necessary resources without interfering with one another. A method of creating stability is called a "System 2" [represented here by the purple triangles]:
To optimize their functioning in relation to one another, there is a "System 3" that oversees the activity of all of the System 1's. It is represented here as a large red rectangle. One way of optimizing is to enact limits (e.g.: legal standards, ethical guidelines, etc.). This ability is represented by a red line connecting the System 3 rectangle to each of the System 1 squares:
The only time that the autonomy of any System 1 should be challenged or completely overridden is when it is putting the viability of the entire system at risk. Again, this model is not necessarily describing a hierarchical relationship! It is not the purpose of a System 3 to command, but to optimize how well the System 1's work together.
Another way of doing this is by bargaining. For example, a System 1 may be provided access to a pool of resources so long as it can meet some specific goal. The System 3 does not "micro-manage" the System 1, but allows it to exercise its autonomy to reach that collective goal. This type of bargaining is represented here as a blue line connecting together the System 3 rectangle to each of the System 1 squares:
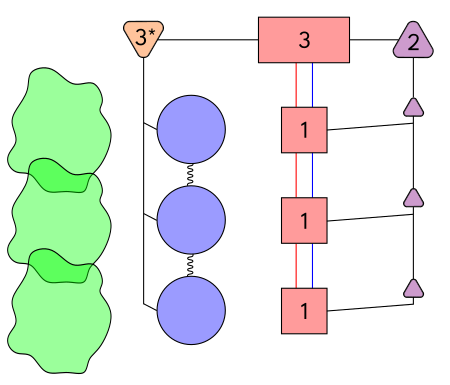
Whenever there is not enough information to make decisions, "System 3*" (pronounced "three-star") gathers more data about the processes of each System 1. [We might call this situation an "audit".]:
Notice that we now have six different vertical connections:
• Overlapping environments
• The relationship of System 1 processes (represented by the squiggly line)
• The stability brought about by System 2
• System 3 optimizing through limits (represented by the red line)
• System 3 optimizing through bargaining (represented by the blue line)
• The data collection of System 3*
Variety is generated horizontally across all of the System 1's, and these six vertical lines are the different ways in which this Variety can be absorbed. The lines are actually feedback loops like the Channels. There is a two-way communication going on here, from the bottom-up and from the top-down simultaneously. In other words, we are trying to make Self-Vetoing Homeostats vertically and horizontally by balancing all of the Variety throughout the entire system.
Ideally, the information interchanged along these lines would be as close to "real-time" as possible (i.e.: available immediately as it is happening). This is called "Algedonics". This helps to keep the system from falling apart. Similarly, "Intrinsic Regulation" is when a system is designed in such a way that the very act of becoming unstable is what brings it back into balance.
Many organizations do not have either of these properties. Information is delayed (e.g.: they keep a lot of records about past events rather than measuring the current state of the system), and they lack features which are "fail-safe".
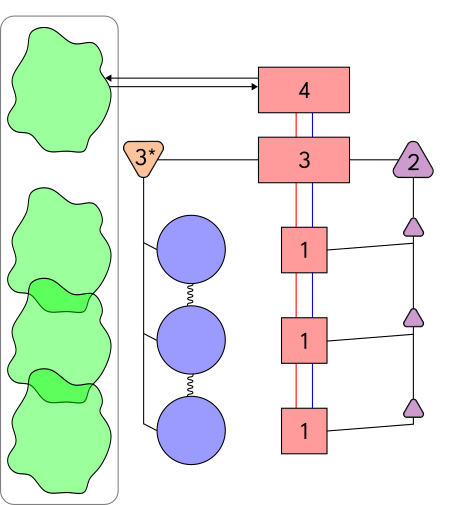
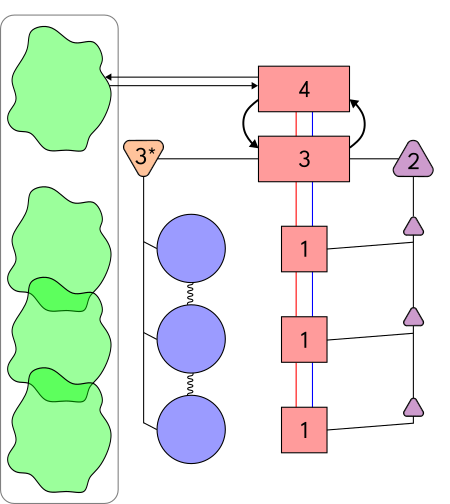
"System 4" anticipates the future by looking out into the environment to see what is coming:
The box with the rounded corners contains the "total environment" in both space and time.
Systems 3, 2, and 1 are collectively referred to as "Inside and Now" because they deal with the internals of the system right now in this moment. System 4 is called "Outside and Then" because it deals with the situation external to the system and what will most likely happen in the future. It is important for a system to be adaptable if it is to stay viable. This balance between inside and outside is represented by another Homeostat [shown here as two bold arrows linking System 3 and System 4]:
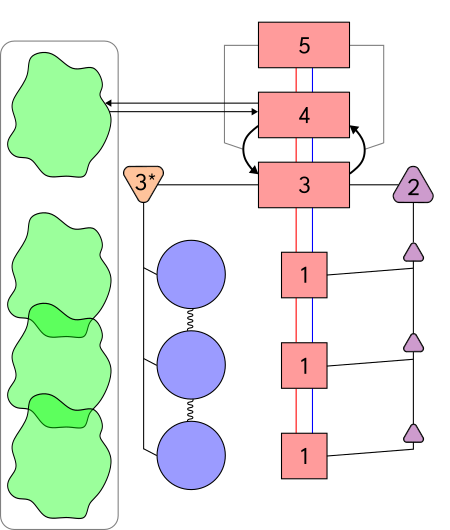
It is the purpose of "System 5" to monitor this Homeostat and create balance through system-wide changes [like those related to "policy"]:
The above diagram is the core of The Viable System Model. In order to apply it, we would pick an organization and label this diagram with the aspects of the organization that fit those functions in some way. Depending upon the complexity of that organization, it will probably be impossible to map it out completely. For example, there could literally be hundreds of System 1's and thousands of Channels. However, no matter how large it is, this basic mapping should point out if important functions are missing and/or if the ways in which they are currently being implemented is inadequate.
If you are having trouble clearly assigning aspects of the organization to the roles of System 1, System 2, and so on, then treat it like a "black box" (i.e.: draw an arbitrary boundary around some portion of the system and look carefully at all of the inputs and outputs). By focusing in on relationships, we can get a better understanding of what is going on inside of it.
[The Viable System Model is actually based on how the human nervous system works. The System 1's are equivalent to all of the automatic functions of the body that we don't have to consciously think about (such as breathing, heart rate, digestion, etc.). This is part of our "autonomic nervous system". System 4 is like the "somatic nervous system", which responds to the information coming in through our senses.]
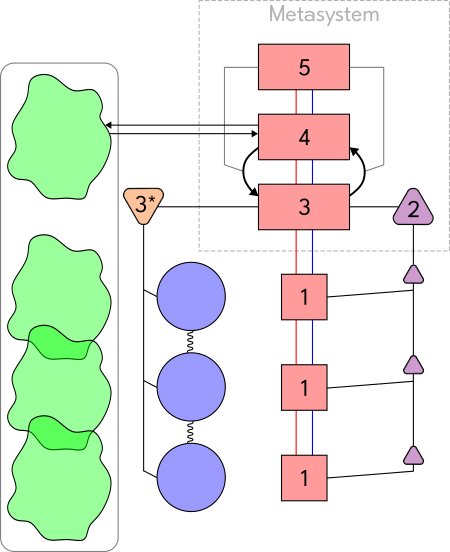
Systems 2 through 5 are collectively referred to as the "Metasystem":
The Metasystem is equivalent to what happens within each red square of System 1. To put it another way, The Viable System Model applies to every level of scale, from the smallest of viable systems to the largest. Therefore, we can think of The Viable System Model as nested inside of itself. This is called "recursion":
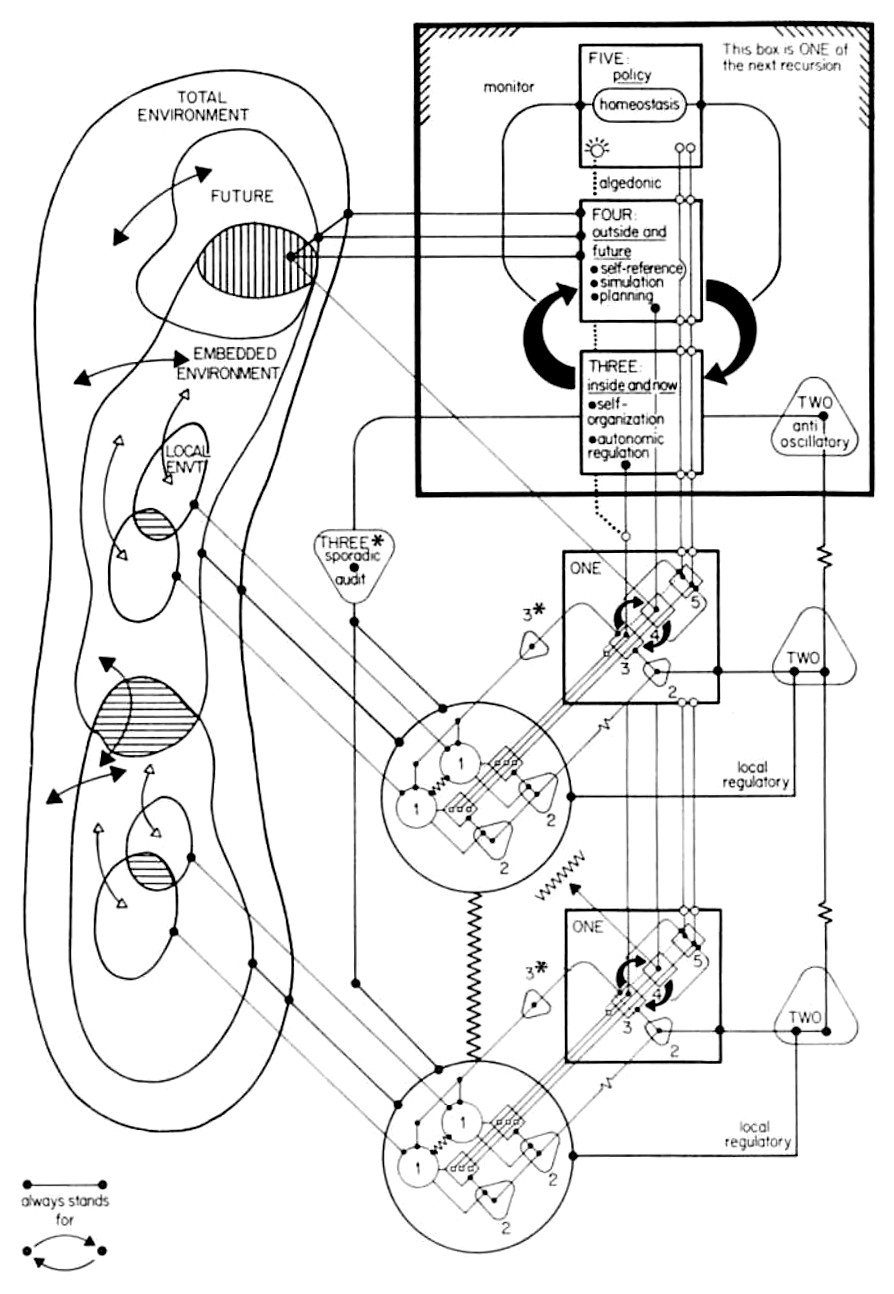
Diagram from the book Diagnosing the System for Organizations by Stafford Beer. Click the image for a larger version.
The entire Viable System Model is repeated within each of the two System 1's in the above diagram. This leads us to "Beer's Law of Viability" which states that "every viable system contains and is contained in a viable system". We can project this model in and out to describe viable systems of any kind and any size!
We hope that this article has been useful to you. Thank you for reading.